


Robinhood Has The Highest Margin In Sports


If you’ve been paying attention, you know that prediction markets have taken the U.S. by storm in recent months. The traditionally slow summer months have led many of us to think about how the current landscape will evolve heading into football season.
Will federally-regulated DCM’s list point spreads, totals, and player props? And what about those parlays?
Traditional sports betting industry experts will tell you that a higher-margin product like parlays is necessary for prediction markets to reach true revenue scale. They may even go as far as to say:
“Prediction markets just won’t work at their current margin. Robinhood makes just $0.01 on each contract, while FanDuel is holding 10%.”
Of course, those who have experience operating in the industry know that while revenue and hold are metrics worthy of keeping tabs on, there are far more important KPIs that determine the success of an operation.
One such KPI is Net Hold Rate which is calculated by how much is kept after direct costs, but before fixed costs (such as general marketing expenses, salaries, etc.)?
Today’s leading operators know that top-line margins are significantly less insightful when compared to profitability indices like net hold percentage.
Since Cesar Hernandez recently hosted an incredibly insightful panel at NCLGS regarding FanDuel’s margins, we’ll use FanDuel as a benchmark representing leading OSB operators versus prediction markets and brokers.

Robinhood versus FanDuel Gross Hold Comparison
According to FanDuel’s Head of Government Affairs Cesar Hernandez, FanDuel achieves a gross hold of $10 for every $100 wagered.
Now what about Robinhood?
Robinhood makes $0.01 on every contract that is traded on the platform. If we assume that the average contract price per trade is $0.50, that’s 2% kept by Robinhood. But a safer assumption would be an average per contract price in the range of $0.30 to $0.40 given events like the Masters where the vast majority of the field is offered at prices below $0.05 (5% odds). Additionally, retail players prefer to bet $3 to win $97, rather than laying $97 to win $3 on a player not to win.
Let’s use an average price of $0.35 per contract.
$0.01 ÷ $0.35 = ~2.85% hold
But that’s not all. Robinhood (like Sporttrade) is all about trading – not just holding your position until the end. And thanks to Robinhood’s innovative UI, you can actually see when traders are adding to their position (handle) versus closing their position (cashing out).
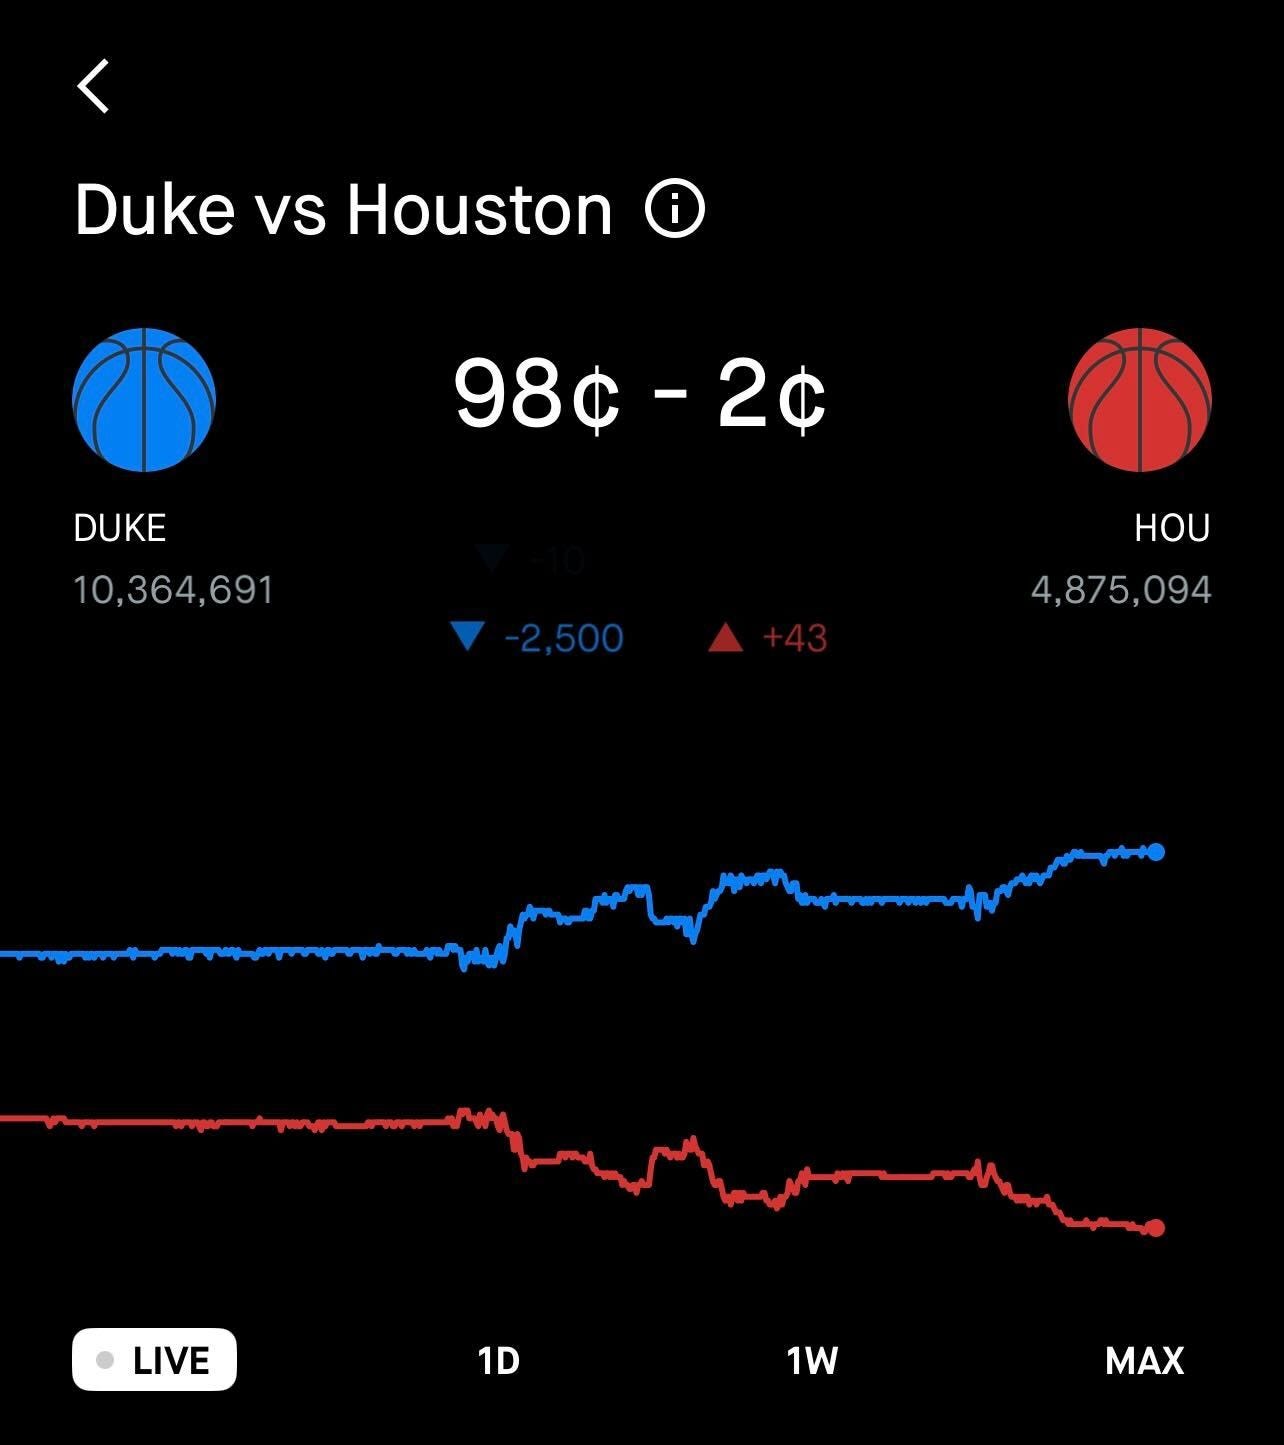
When a user closes a position on Robinhood, Robinhood still earns their $0.01 per contract, yet that activity isn’t classified as “handle” as the user isn’t taking any risk.(Think of this like a cashout.)
If we assume that 20% of the trades made on Robinhood are de-risk trades, we must further adjust Robinhood’s hold to get a true apples-to-apples comparison.
2.85% hold / 80% of trades made are actually “handle” = ~3.57% gross hold.
Okay, so it’s not actually 10% versus 1%, it’s closer to 10% at Fanduel versus 3.57% with Robinhood.

Whittling Down to Net Hold Rate
As mentioned above, gross hold rate isn’t a great metric as we evaluate the profitability and potential longevity of a venue.
This is where Robinhood begins to make up a ton of ground versus today’s biggest OSB operators. As Cesar points out, FanDuel owes $0.25 on each $100 of handle on Federal Excise Tax (FET), and roughly 22% of their gross revenue as state taxes blended across all states.

FanDuel’s initial “10% to 3.57%” lead has been cut significantly. As an FCM registered under the CFTC, Robinhood pays tax on neither revenue nor volume (FET).
Promotions
In traditional sportsbook wagering, operators give out a significant amount of “free money” to players in the form of credits for both acquisition and retention.
According to Hernandez, 33% of FanDuel’s gross revenue consists of bet credits used and lost by players that don’t actually yield into real dollars for the company. Shockingly, FanDuel still owes tax on these credits in most states.
To those who aren’t familiar with Robinhood's offering, Robinhood has not offered a singular promotional dollar related to prediction markets. This disparity between how the companies attract and retain users serves as a huge equalizer as it pertains to gross profit margins, as you’ll see below.

Other Direct Costs of Revenue
There are still more costs that regulated operators pay that are a function of player activity, deposits, and signups that we would categorize as a “direct cost” of operating, including game state data, payments, geolocation, KYC, and revenue shared to market access partners such as casinos or racetracks. These are our rough estimates below of what these cost.

While we took some liberties here, we feel we’re not too far off in our guesstimates. For example, it been reported that DraftKings pays 12% of their revenue as payments costs.
Robinhood largely has funds on the platform from the many different offerings it has for its customers and it doesn’t bear the same game-state data cost because…well, why would they? They’re just a broker who routes orders to an exchange. They don’t price markets themselves, and so their need for real-time data is low.
Same thing with geolocation and market access costs. Robinhood is federally regulated, and can offer their prediction market product to customers in any state they choose, without the need to pay other businesses for the right to operate.
Side note: the requirement many states have in "tethering" online sports betting rights to land-based operators has been one of the most anti-consumer and anti-innovator policies of state-regulated sports betting.
Summary (Skip here if you don’t feel like reading)
Robinhood boasts a higher-margin sports business than FanDuel!
And if you’ve read this far, you’ve seen why. Here’s the summary visually:


By our math, while FanDuel holds $10 to Robinhood’s $3.57 at the top-line, Robinhood keeps $3.38 net of direct costs to Fanduel’s $2.55.
Obviously some of the lower costs Robinhood is able to enjoy come as a result of how they’re classified as a federally regulated futures broker, but other advantages relative to OSB operators are due to entrenched scale and product advantages such as a lower cost of payments and next to no promotions.
What isn’t counted in this comparison?
If you’ve read Jess’s piece on FanDuel’s margin, she notes that Cesar Hernandez reports that FanDuel keeps roughly $1.55 of profit per every $100 wagered. Our math above shows a gross profit of $2.55 because we’re only looking at direct costs of revenue.
Of course, FanDuel is paying staff salaries, marketing, and other fixed costs like licensing fees, audits, insurance, etc. While Robinhood also has those costs, it would be fair to assume that the sports trading offering is largely incremental to their core business investment, which would lead to an even larger net profit margin for Robinhood.
Why it matters
Those who say prediction markets are low margin and thus need parlays to achieve true scale simply don’t understand how the revenue models of online sportsbooks and prediction markets compare and contrast.
As competition increases and margins compress in federally-regulated prediction markets, venues have plenty of breathing room to provide tighter spreads to consumers while retaining healthy margins.
why are you assuming that robinhood doesn’t pay for sports data? is that handled by Kalshi?